
Market Data Bank

Click image to enlarge
Stocks made a comeback in 4Q2015, following a correction in August and September. Prices climbed steadily in October before leveling out in November and December. Good economic news kept coming, and the S&P500 returned, including dividends, 7% - a very strong quarter.
Click image to enlarge
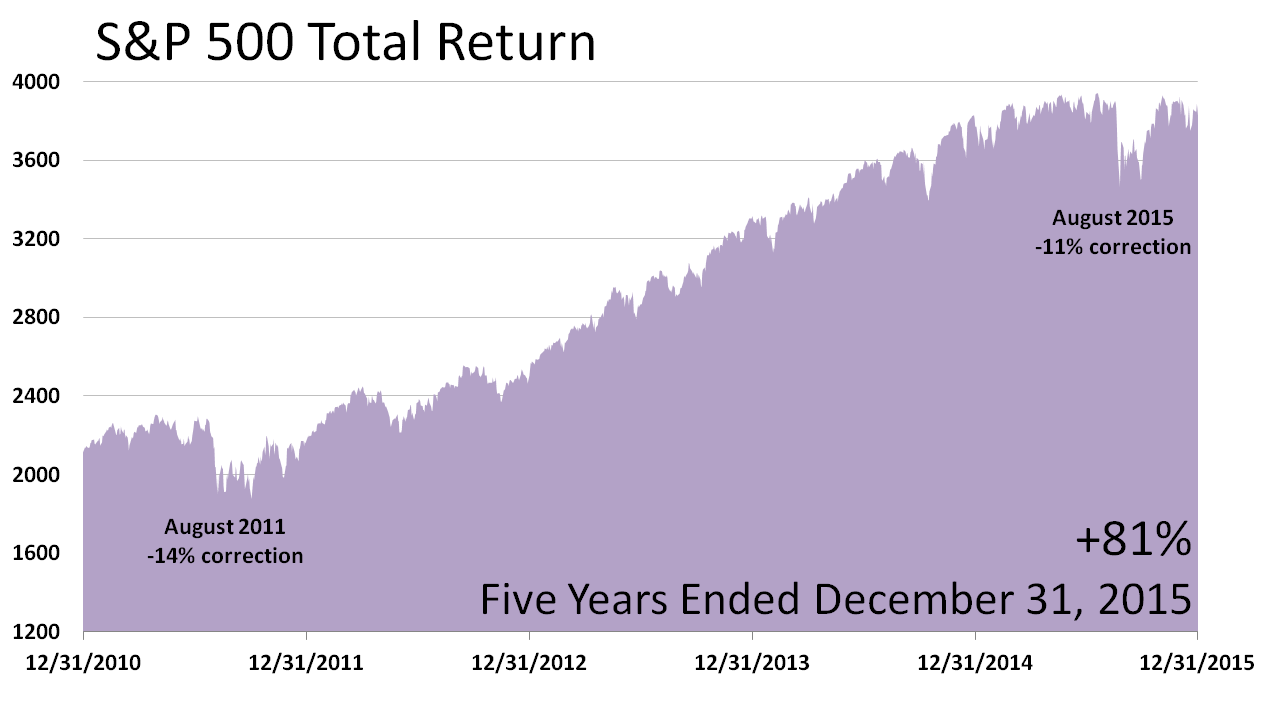
When you look at the progression of stock prices over the five years that ended December 31, 2015, you can see a leveling-off in returns in 2015. Stocks took a breather. Still, the S&P 500 total return of 81% was breathtaking compared with most five-year periods in history.
Click image to enlarge
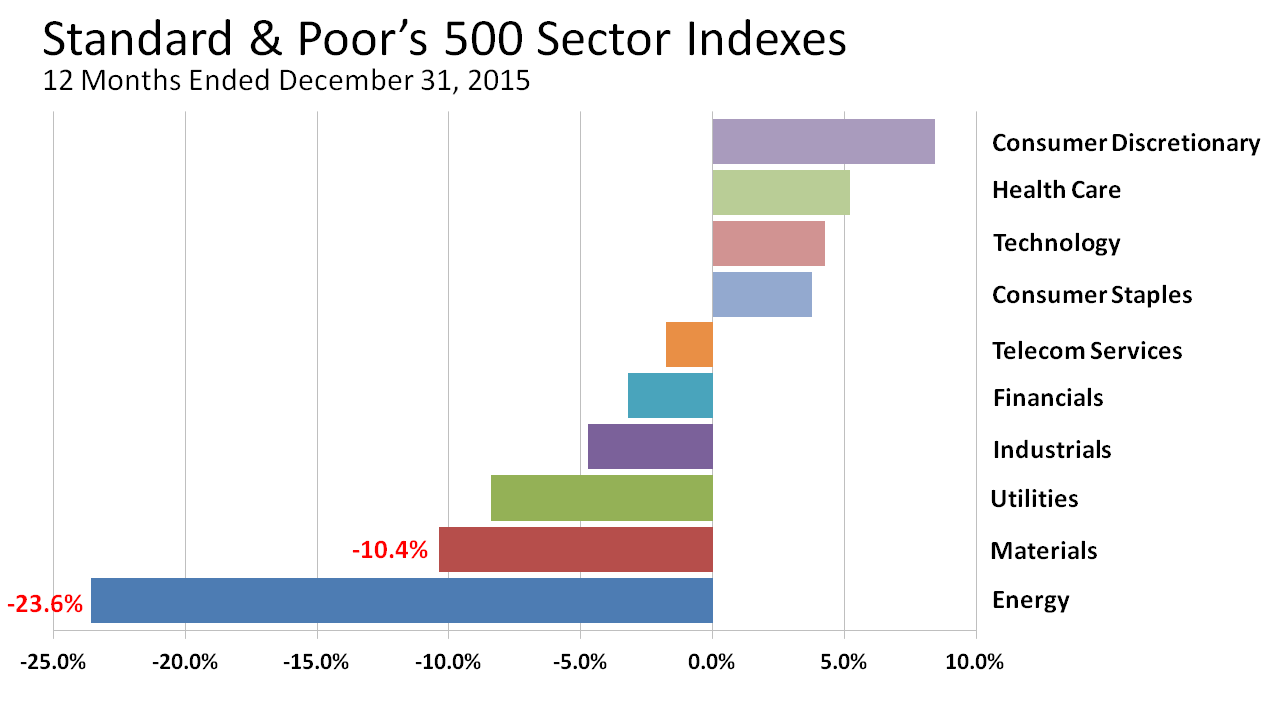
U.S. consumers drove economic growth, powering discretionary consumer-goods companies to the top of Standard & Poor's 10 industry indexes. Health care issues sailed upward again, while low oil prices dealt energy shareowners a 23.6% loss of capital.
Click image to enlarge
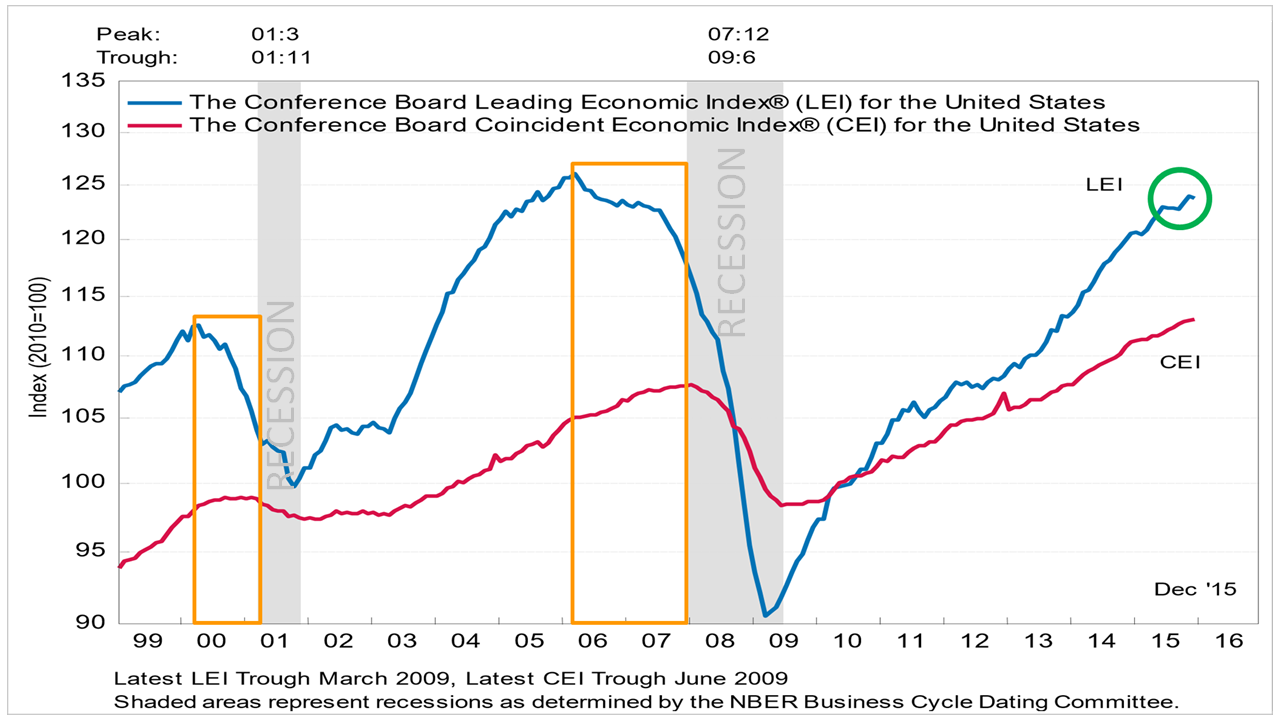
Months before recession (gray), U.S. LEIs turn down (orange). In 2015, the LEIs haltingly rose. Meanwhile, the Federal Reserve is years away fromrestrictive policy and the yield curve is nowhere near inversion. These positives support stock prices, but markets are emotional.

Click image to enlarge
In this five-year period, U.S. stocks were No. 1. Over the next five years, will the same thing happen? No one knows. Diversifying broadly means you won't ever perform as well as the No. 1 asset class. But it also means your portfolio won't ever perform as poorly as the worst asset class. Oil lost 45.3% in the five years.

Click image to enlarge
Red squares show expected earnings on the S&P 500 index based on a January 4, 2016 forecast by Wall Street analysts for earnings of $117 per share in 2015, $127 in 2016, and $143 in 2017. Earnings growth is poised to propel stocks higher, unless a crisis or really bad unexpected news sets world progress back.
Past performance of investments is not a very reliable indicator of future performance. Indices and ETFs representing asset classes are unmanaged and not recommendations for any specific investment. Foreign investing involves currency and political risk and foreign-country instability. Bonds offer a fixed rate of return while stocks fluctuate. Estimated bottom-up S&P 500 earnings per share as of January 4, 2016 was $117.26 for 2015, $126.91 for 2016 and $142.80 for 2017. Sources: Yardeni Research, Inc. and Thomson Reuters I/B/E/S survey of consensus estimates. Standard and Poor's for index price data through January 8, 2016; and actual earnings data through 2015.
INDEX OF MARKET DATA BANK
Latest News
© 2024 Ivy League Financial Advisors LLC
11 North Washington Street, Suite 250, Rockville, MD 20850
P: 301-258-1300 / 877-321-PLAN / F: 301-990-9664 / This email address is being protected from spambots. You need JavaScript enabled to view it.


